Talent Attraction and Retention

Human Resource Distribution
Unimicron encourages a diverse and open workplace culture and respects the uniqueness of each employee. In terms of recruitment, employment, evaluation, and promotion selection regardless of age, gender, race, religion, political beliefs, marital status, labor union affiliations, and background are treated fairly and equally, where the only considerations are finding the appropriate candidate for the appropriate position, and creating fair and diverse employment opportunities for all operation sites to promote local economic growth. By the end of 2022, the total number of formal employees at Unimicron was 28,402, the same as the previous period. The number of new employees and the deployment of dispatched manpower are adjusted on a rolling basis according to the current year's order situation, and a healthy turnover rate is maintained. As industrial production is semi-automated, some processes still rely on manual and labor-intensive work. Therefore, the proportion of male employees is higher than that of female employees. In 2022, migrant workers in Unimicron’s Taiwan Facilities are from the Philippines; as the Philippines is an English-speaking country, it is relatively easier to communicate. 78% of the employees at our plants in Mainland China are direct technical laborers.
2022 Employment Status
(Unit: People)
Note 1: * Gender as specified by the employees themselves.
Note 2: Outsourced workers include security, cleaning, and catering workers working in the plants. There are 428 workers in the Taiwan Facilities and 504 workers in the China Facilities in 2022.
2022 Job Category
Local Employment
Note: Senior executives refer to Sr.Director level (inclusive) or higher employees. Local resident means an employee of the same nationality as the Plant location.
2022 New Employees
Note: Rate = Annual new hires (non-fixed-term new hires employed for longer than three months) / Number of current employees (non-fixed-term employees) in the age category at year-end (December 31).
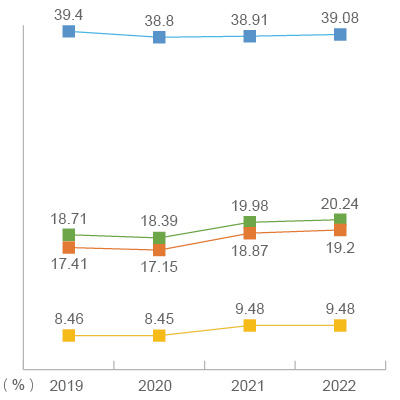
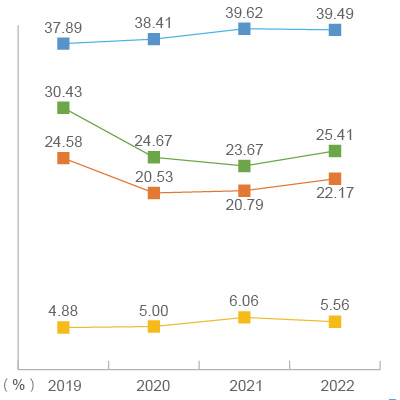
Female Employees
(Unit: %)
Note 1: All management refers to deputy manager/manager level (inclusive) or higher. Junior management refers to the deputy manager or manager level.
Note 2: The denominator of the proportion of female management is all management; the denominator of the proportion of female top management is all top management; the denominator of the proportion of female junior management is all junior management.
Females in Junior Management Females in Top Management
Taiwan
Mainland China
Disability Employment at Taiwan Facilities
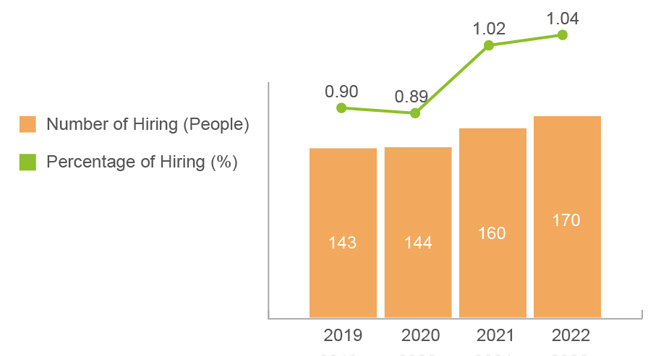
We support the employment of people with physical and mental disabilities, and employed 170 people with physical and mental disabilities in 2022, achieving our planned ratio. In addition to evaluating the work duties and providing employment opportunities for people with physical and mental disabilities, care for staff health by the Physicians regularly, we also actively cooperated with the Ministry of Labor’s job redesign program; installed wheelchair ramps and handrails in toilets; and provided assistive devices to build a friendly workplace.
Talent Retention
In addition to establishing a competitive salary and compensation system and talent retention system, Unimicron offers a variety of measures and bonus systems that are better than the law requires, and provides employee protection through a comprehensive salary and benefit structure, while emphasizing gender equality. In order to enhance the recruitment and retention of female employees, the Company attaches great importance to the maternal health protection system, implements comprehensive maternal protection measures, and provides a variety of rich and complete health promotion activities. In 2022, the Company received the National Award for Healthy Workplace - Maternal Health Friendly Award and established a comprehensive sexual harassment prevention mechanism to create a friendlier workplace environment.
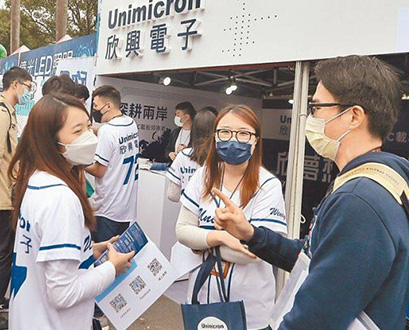
Main Talent Recruitment Channel
Unimicron has a comprehensive recruitment standard mechanism that combined various recruitment channels, continuously recruits talents, and injected continuous momentum to offer students good opportunities and implement corporate sustainable responsibility.
- Job Bank
- Campus Recruitment
- Staff Introduction
- Industry-Academia Collaboration Projects
Assistance and Guidance for New-Employees
For New-Employees, counselors will provide work and technical assistance, and through various methods to help New-employee adapt to the new workplace faster.
- Regularly need to talk to New-Employees to adapt to the new workplace
- Assist in completing professional certifications such as license identification, etc.
- Discover new employees’ learning problems, react, and communicate with them
- Implementation of counselor mechanism
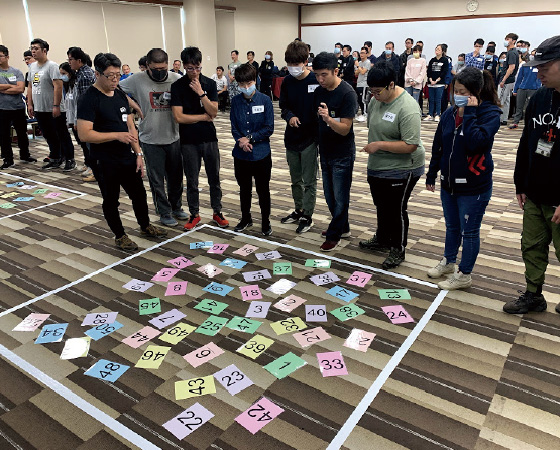
Retention Plan
Optimize Compensation Competitiveness and Ensure the Retention of Outstanding Talents
- Compensation Adjustment Due to Excellent Performance
- Retention Bonus
Strengthen the Rotation Mechanism and Cultivate T-Shaped Talents
T-shaped talents represent the width of their knowledge and depth of technique and know-how. The combination of the two accounts for deeper professional understanding, a broader knowledge base, and cross-disciplinary abilities
Retention Strategies
- Year-End Bonus
- Annual Salary Adjustment
- Stock-Based Compensation
- Patent Bonus
- Performance Retention Bonus
- Retention Bonus for Key-Talent
- Employee Remuneration
- Achievement Bonus
- Retention bonus for New Hire
2022 Excellent Engineers Retention Rate
In 2022, the retention rate of excellent engineers was 90%, effectively achieving the purpose of attracting and retaining talents, and at the same time promoting the sustainable development of the Group.
Note: Excellent Engineers Retention Rate=the number of employees with "excellent" or above performance in the second half of the previous year who were still on board at the end of the month/the total number of employees with "excellent" or above performance in the second half of the previous year * 100%.
Employee Turnover Management
In terms of employee turnover management, the turnover rate fluctuates slightly, but remains at a fixed level. Unimicron will continue to invest in employee retention planning to provide better benefits and salaries to retain talent. When the employee requests to resign, the relevant supervisor will immediately interview, and the HR Division will conduct a one-on-one interview to concern the reasons, and make work adjustments or care as needed. In 2022, 41 staff were successfully Internal Transfer.
Employee Turnover Rate
(Unit: %)
Note: Voluntary Turnover Rate= Annual total number of turnovers (irregular employees who leave the Company after working for more than 3 months)- involuntary turnover (irregular employees who leave the Company after working for more than 3 months)/ year-end (Dec. 31) number of employees (non-fixed-term employees).
2022 Turnover Statistics
Note: Turnover Rate= Annual number of departures (non-fixed-term resigning employees employed for longer than three months) / year-end (Dec. 31) number of current employees of category by age (non-fixed-term employees).
Parental Leave
In 2022, a total of 162 employees in the Taiwan Facilities applied for nursery leave without pay, and the expected number of nursery leave reinstatement for the whole year was 163, of which 140 were reinstated as scheduled or ahead of schedule, with a return rate of 85.89%; in terms of retention rate for reinstated employees, of the 101 employees who were reinstated in 2021, 77 were still working at the end of 2022, with a retention rate of 76.24%. Compared with the previous period, the retention rate has decreased by 14.17%. 80% of the employees who left after one year of reinstatement were female employees, and the reasons for leaving were mainly family factors.
Parental Leave in Taiwan
Note 1: Mainland China does not implement the system of parental leave without pay, so it is not included in the statistics.
Note 2: Calculated based on the employees who have applied for maternity leave and paternity leave from 1/1/2019 to 12/31/2022.
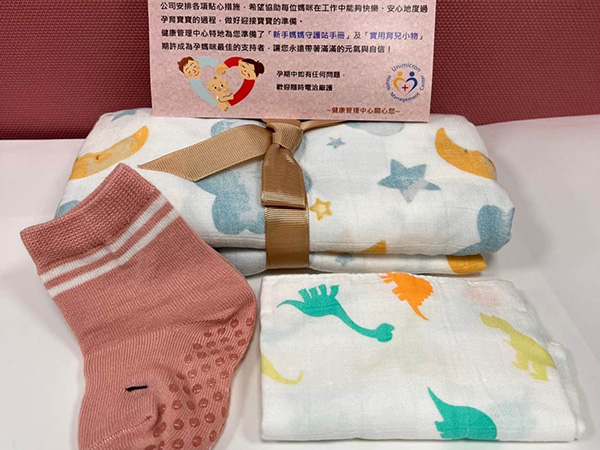 Pregnancy Gifts
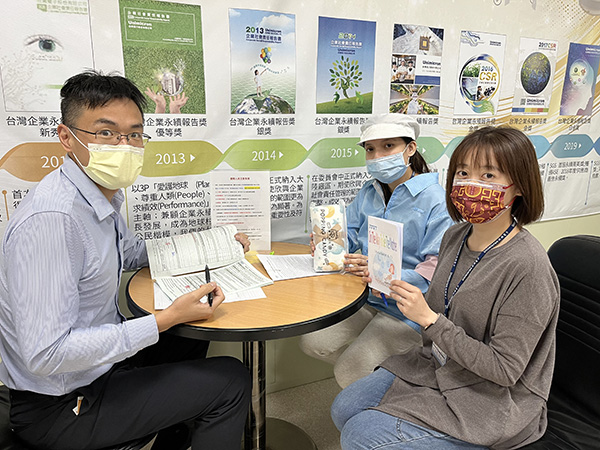 Pregnancy Care


