Industry Overview and Global Market
PCBs are a key component of various electronic products. They are used in computers, communications, and various consumer electronic products and equipment. In recent years, they have been widely used in the automotive, industrial, medical, military and aerospace industries. Therefore, the development of this industry is driven by the advancement of modern science and technology and is closely related to the demand for various end products. In 2022, due to the prosperous development of 5G, AIoT, high-performance computing, etc., the company’s substrate product portfolio optimization and yield continued to improve, and operational performance improved significantly with the cooperation with customers in the field of high-end substrate technology expansion and the development of long-term relationships have improved the future and stability of the company; Other product lines such as substrate-like, HDI and PCB, actively develop new clients and improve the yield. Looking forward to 2023, due to the ongoing impact of high interested rates, inventory correction, Russia Ukraine War, global inflation, and geopolitical tension, uncertainties in the global economy still remain, market situation may not recover completely. However, under the huge business opportunities of 5G, AIoT, high-frequency, high-speed demand, and high-performance computing applications in the future, it will diversify and broaden the application of PCB industry, especially high-end substrate.
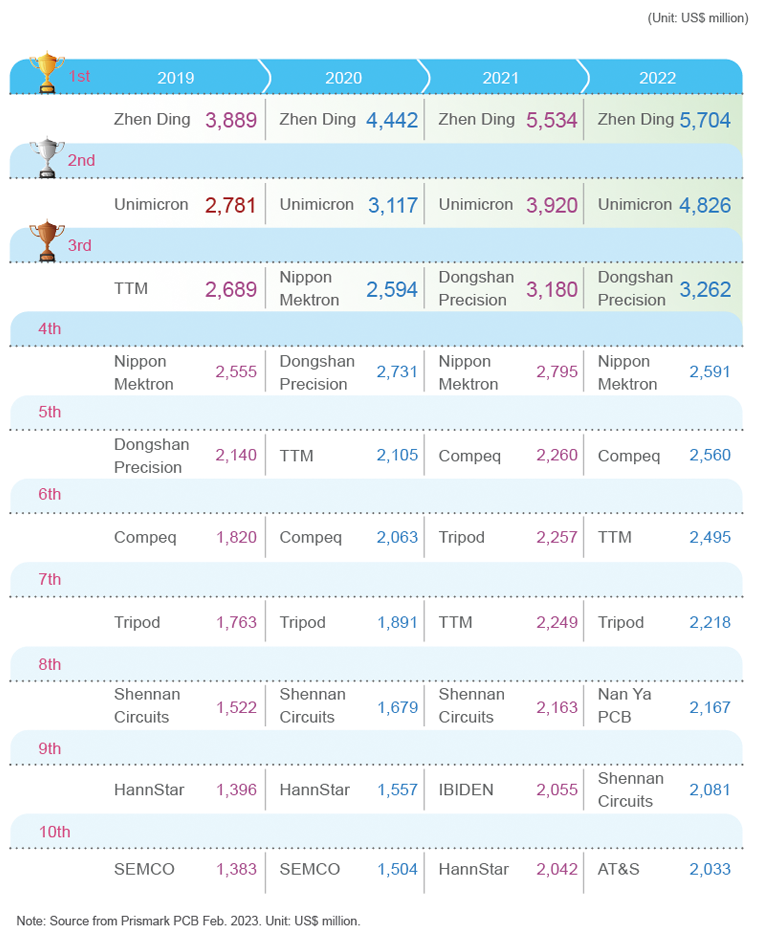
The Global Printed Circuit Board Market
Products and Services
Unimicron mainly consists of three SBUs including Printed Circuit Board (PCB) and Carrier. We are now the world’s second-largest PCB and Carrier manufacturer in terms of revenue, and the main supplier of mobile High-Density Interconnect (HDI) and Carrier boards. Unimicron’s main production bases are in Taiwan (Taoyuan and Hsinchu), South China (Shenzhen), Central China (Huangshi), and East China (Kunshan and Suzhou). Our Mainland China plants focus on mass production, whereas Taiwan facilities offer high-end products. Unimicron has business divisions and representative offices in America, Europe and Asia, and production bases in Germany and Japan to provide comprehensive services to our customers nearby.
Development Trends of Products
The mainstream applications of end electronic products are multi-performance integration, high speed computing, large screens, energy saving and miniaturization. The growth potential of market applications comes from network communication products such as servers, data centers, automotive electronics driven by development of electric vehicles and smart cars, and new applications of 5G, AIoT, etc. With the introduction of high speed computing products and 5G related devices, the demand for high-end carrier processes has increased significantly. The Company shall improve customers’ design freedom and product reliability; so that the stability, speed and low latency technologies of product signal transmission can be continuously improved and upgraded. The demand for FPC and RF products mainly benefited from the trend of multifunctional, light and thin handheld electronic devices. Customers’ designs largely adopt FPC unique features such as lightness, thinness, and flexural strength to connect the signal transmission between the modules and the motherboard in a limited space, in order to effectively reduce the internal space and weight of the device.
As the complexity of end products increases, the packaging technology’s requirements for high frequency, high performance, and low power consumption make the chip design move toward high I/O density and fine pitch, high heat dissipation, and superior electrical characteristics, which in turn drive the related carrier requirements of 3D system packaging, embedded components, ultra-fine lines, low power consumption and others. Some products are affected by market competition and structural changes, and the demand for low cost solutions cannot be ignored. However, in terms of overall technology trends, in conjunction with the next generation of process development in the semiconductor industry, the carrier industry continues to develop relevant high level processes and cooperate with customers to expand product applications.
Major Products' Sales by Region(Unit: NT$ Thousand)
| Years |
2019 |
2020 |
2021 |
2022 |
| Sales Regions |
Amount |
% |
Amount |
% |
Amount |
% |
Amount |
% |
| Domestic |
18,586,998 |
23% |
18,516,445 |
21% |
21,188,108 |
20% |
33,997,844 |
24% |
| Exports |
Asia |
56,470,465 |
67% |
62,665,798 |
71% |
76,202,891 |
73% |
98,197,671 |
70% |
| Americas |
2,099,195 |
3% |
2,094,416 |
3% |
2,553,529 |
2% |
3,683,318 |
3% |
| Other |
5,378,895 |
7% |
4,616,162 |
5% |
4,618,219 |
5% |
4,610,339 |
3% |
| Subtotal |
63,948,555 |
77% |
69,376,376 |
79% |
83,374,639 |
80% |
106,491,328 |
76% |
| Total |
82,535,553 |
100% |
87,892,821 |
100% |
104,562,747 |
100% |
140,489,172 |
100% |
Note: There are no products or services that are banned in certain markets.
Sales Volume and Value
| Years |
2019 |
2020 |
2021 |
2022 |
| Main Product |
Amount |
Value |
Amount |
Value |
Amount |
Value |
Amount |
Value |
| PCBs |
93,846,000 |
46,615,761 |
93,574,000 |
43,447,778 |
93,060,000 |
45,673,845 |
99,089,910 |
36,666,244 |
| Others |
- |
- |
- |
8,381 |
- |
8,806 |
- |
8,376 |
| Total |
93,846,000 |
46,615,761 |
93,574,000 |
43,456,159 |
93,060,000 |
45,682,651 |
99,089,910 |
36,674,620 |
Note: Consolidated information. The production capacity of this table is in gross square feet and the output volume is in net square feet. Product assembly highly affects the output volume, and the production capacity is for reference only.
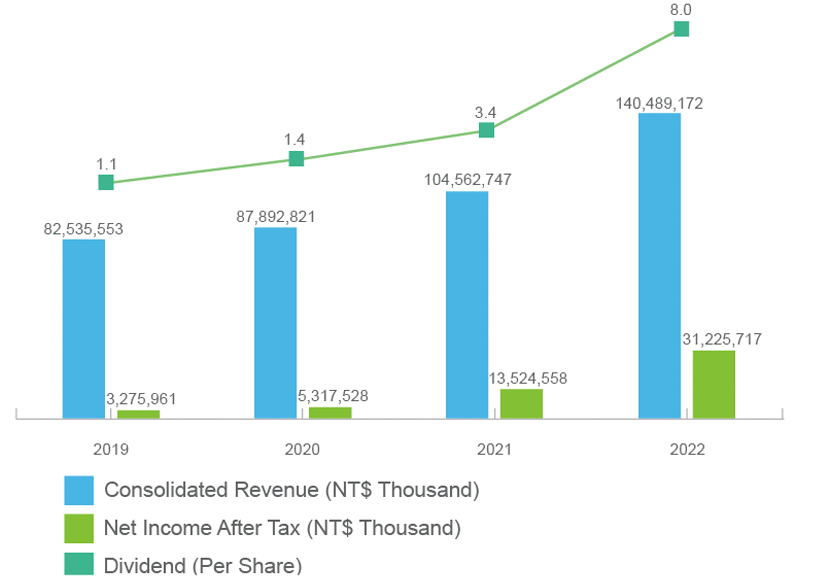
Financial Performance
Unimicron's consolidated revenue for 2021 is NT$104,489 million and its consolidated net income is NT$31,226 million. Unimicron is a professional manufacturer of PCBs. According to Prismark's production value data, Unimicron’s consolidated PCB revenue will account for approximately 5.7% of the global PCB production value in 2022.
| Item |
Unit |
2019 |
2020 |
2021 |
2022 |
| Global PCB Output Value |
USD Million |
61,311 |
65,219 |
80,449 |
83,256 |
| Market Share of Unimicron’s Consolidated PCB Operating Revenue |
% |
4.3% |
4.5% |
4.6% |
5.7% |
In 2022, due to the prosperous development of 5G, AIoT, high-performance computing, etc., the company’s substrate product portfolio optimization and yield continued to improve, and operational performance improved significantly with the cooperation with customers in the field of high-end substrate technology expansion and the development of long-term relationships have improved the future and stability of the company. Other product lines such as substrate-like, HDI and PCB, actively develop new clients and improve the yield. PCBs are key components of various electronic products, which are used in computers, communications, and various consumer electronic products and devices, and in recent years, they are widely used in automotive, industrial, medical, military, and aerospace fields, etc.
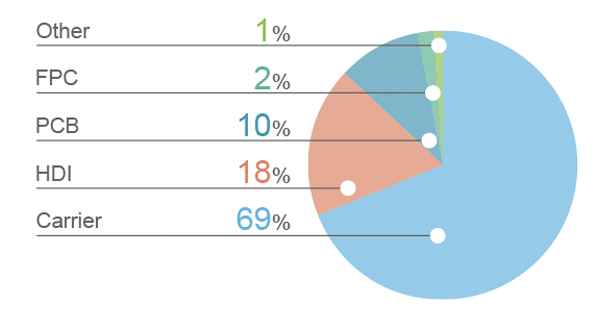
2022 Production
|
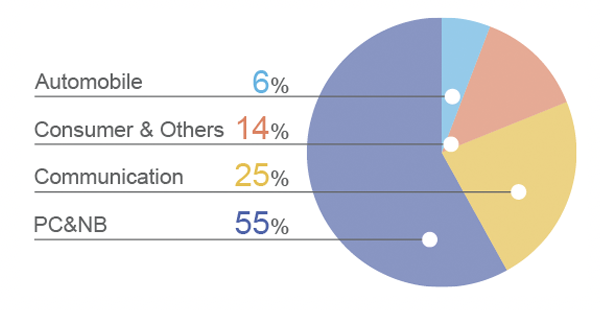
2022 Terminal Product Market
|
| Item |
Unit |
2019 |
2020 |
2021 |
2022 |
Note |
| Debt to Asset Ratio |
% |
56.12 |
57.42 |
61.47 |
57.63 |
Consolidated |
| Equity to Assets Ratio |
% |
43.88 |
42.58 |
38.53 |
42.37 |
Consolidated |
| Earnings Per Share (EPS) |
NT$ |
2.24 |
3.74 |
8.98 |
20.08 |
Consolidated |
| Non-consolidated Income Tax (Expense) Benefit |
NT$ million |
(557) |
(773) |
(2,704) |
(7,142) |
|
| Consolidated Income Tax (Expense) |
NT$ million |
(763) |
(917) |
(3,104) |
(8,649) |
|
| Non-consolidated Total Assets |
NT$ million |
86,091 |
100,419 |
135,229 |
173,492 |
|
| Consolidated Total Assets |
NT$ million |
110,202 |
124,710 |
170,055 |
218,663 |
|
| Capital |
NT$ million |
15,047 |
15,047 |
14,753 |
14,784 |
Paid-in |
| Non-consolidated Total Revenue |
NT$ million |
47,405 |
54,076 |
69,338 |
100,178 |
|
| Consolidated Total Revenue |
NT$ million |
82,536 |
87,893 |
104,563 |
140,489 |
|
| Non-consolidated Net Profit Before Tax |
NT$ million |
3,817 |
6,235 |
15,926 |
36,760 |
|
| Consolidated Net Profit Before Tax |
NT$ million |
4,038 |
6,234 |
16,629 |
39,875 |
|
| Total Market Capitalization |
NT$ million |
54,140 |
94,603 |
197,006 |
260,931 |
Based on the stock price at the end of each year (Calculated based on annual average price) |
| Non-consolidated Operating Expense |
NT$ million |
4,180 |
5,212 |
6,669 |
8,343 |
|
| Consolidated Operating Expense |
NT$ million |
7,811 |
8,859 |
10,629 |
12,366 |
|
| Retained Earnings |
NT$ million |
21,877 |
25,707 |
36,897 |
61,632 |
|
| Employee Benefit Expense |
NT$ million |
19,037 |
21,546 |
24,042 |
29,589 |
Consolidated |
| Average Employee Revenue |
NT$ million |
2.71 |
2.81 |
3.59 |
4.79 |
Consolidated |
| Dividend (Per Share) |
NT$ |
1.1 |
1.4 |
3.4 |
8.0 |
|
| Donation Expenses |
NT$ million |
2.6 |
4.7 |
14.6 |
9.4 |
Individual |
Note 1: Total market capitalization = average stock price × weighted average number of shares.
Note 2: Average Employee Revenue = Consolidated Total Revenue / Number of employees in 2022 Annual Report.